This study is exploratory and uses digital visualizations to unpack the data In this project, I used various digitalization platforms for analysis. Though visualization is not a methodically approach, it doe provide a critical lens to reimaging how to find, interpret, and understand data. As noted, all data was collected by WeTheProtesters and scrapped from TheDemands.org website. All data was exported into text files and demands were thematically coded to find prevailing trends in student demands (Saldana, 2013).
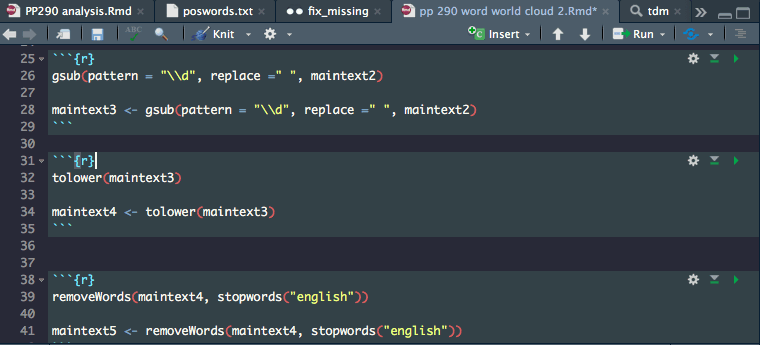
R is a programming langage used for statstical computing and graphics. R was used to clean data and run analysis.
Topic Modelling Tool (powered by MALLET) is a platform that generates emerging "topics" in various docuements.
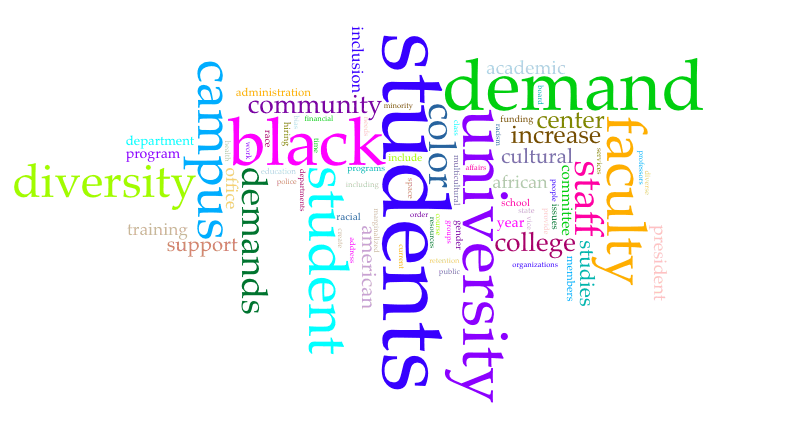
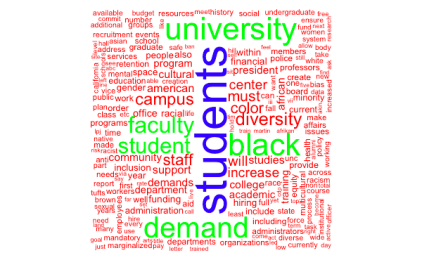
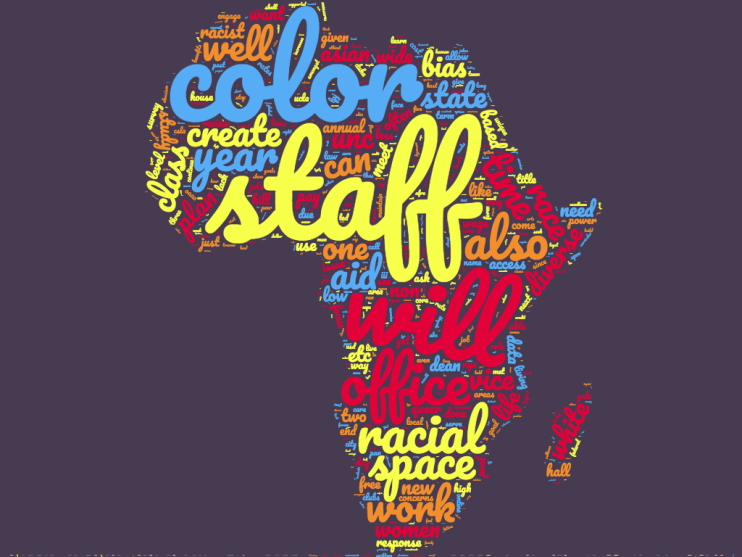
Word clouds is a data visaulization tool to identify common words used in texts, Clouds were powered by R and WordCloudcom.
Tableau Public platform to create and publish interactive data visualizations to the web.
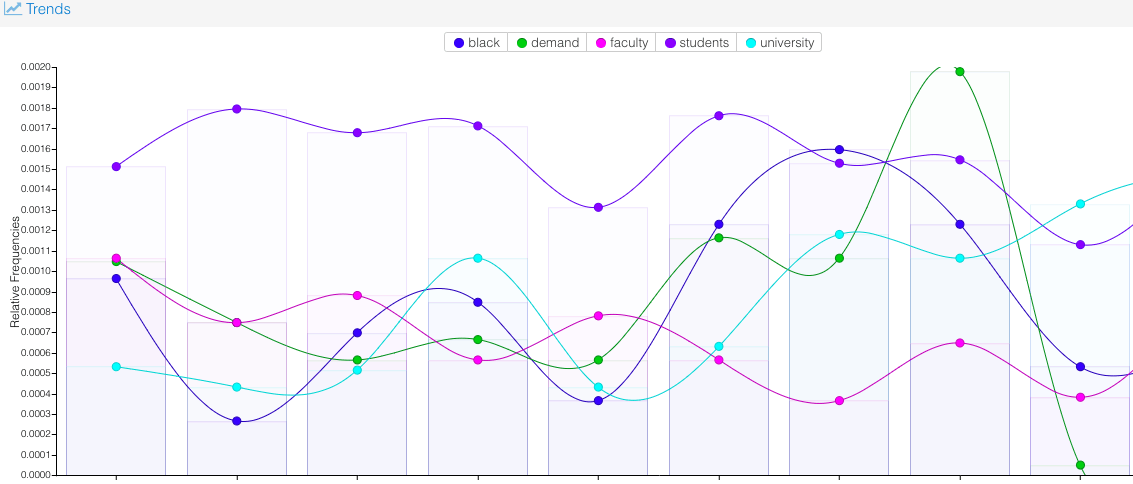
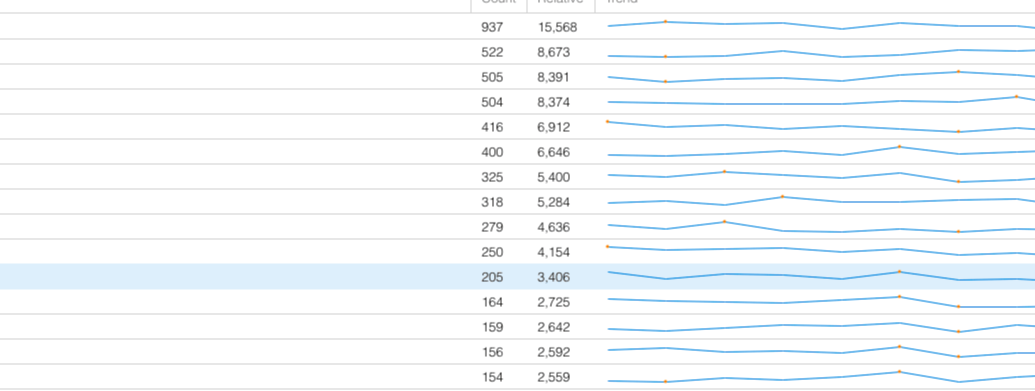
For preliminary findings, I used Voyant, an open-source, web-based application that provides text analysis. This analysis helped to frame the key findings and provide direction in framing research questions.
Using R

Using WordCloud.com
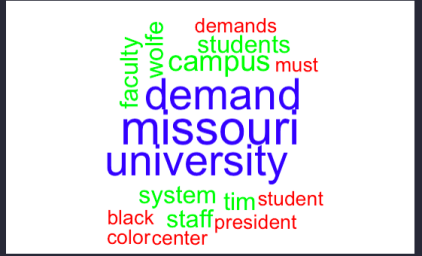
I created two word clouds: one using the original demands from the University of Missouri and a word cloud using all the demands collected by TheDemands.com. The clouds highlight different words, even though it uses the same data. Overall, both clouds illustrate how expansive the demands became after the initial interiation from Missouri.
Photo is a screenshot of the data cleaning process in R. For more visualizations, see the findings tab.
Using R
WordCloud.com

Matt Griffith
mlgriffith8@gmail.com Twitter: @_mattgriffith